
Home Assistant Dashboards for Tracking Household Wattage in Real-Time
Build a Home Assistant power dashboard that shows live household watts, appliance loads, short-term trends, and daily energy without confusing W with kWh.
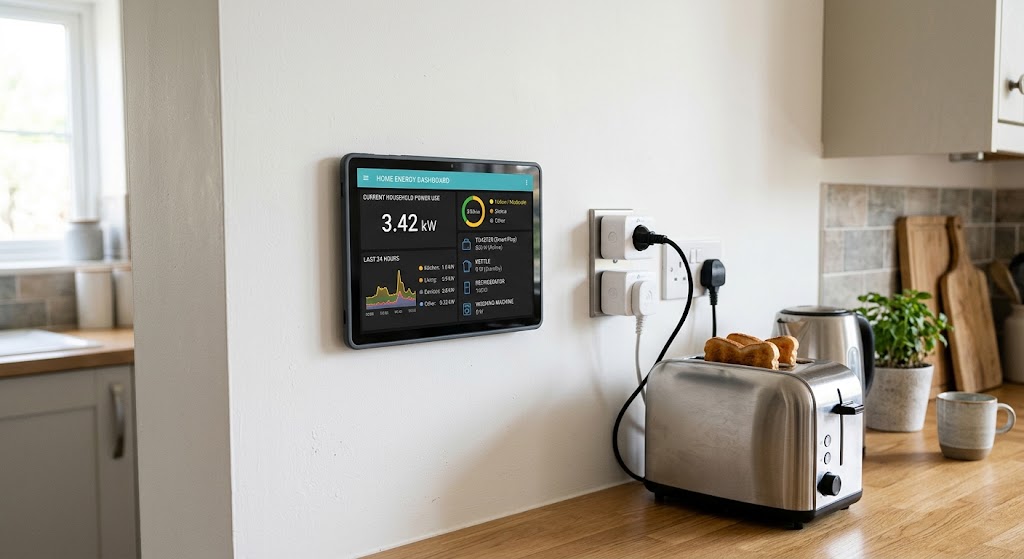
Quick answer
To track household wattage in real time with Home Assistant, start with one or more sensors that report instantaneous power in watts or kilowatts, then display those entities on a normal Home Assistant dashboard using cards such as Sensor, Distribution, and History Graph. Use a separate energy sensor in kWh for accumulated consumption; if a device only reports watts, Home Assistant's Integral helper can convert the power readings into energy for the Energy dashboard and daily totals.
Table of contents
- First: watts and kWh are not interchangeable
- Decide what level of power data you actually have
- Whole-home power
- Circuit-level power
- Appliance-level power
- Check the power entities before designing the dashboard
- The best native dashboard layout for live household wattage
- Card 1: use a Sensor card for the current household load
- What you can learn from this card
- Card 2: use the Distribution card for appliance and circuit loads
- Keep the list short enough to read
- Card 3: add a History Graph for recent spikes and cycles
- Patterns worth looking for
- Card 4: use statistics for trends, not for second-by-second monitoring
- Convert watts to kWh with the Integral helper
- Why this belongs outside the live-wattage section
- Add the derived energy sensor to the Energy dashboard
- Use Utility Meter when you want daily or monthly buckets
- A complete dashboard structure that stays understandable
- Section 1: right now
- Section 2: last few hours
- Section 3: today
- Section 4: longer-term trend
- Example dashboard YAML using only native cards
- How to find phantom loads without fooling yourself
- Power thresholds can turn the dashboard into automation
- Common mistakes that make power dashboards misleading
- Mistake 1: labeling kWh as “current power”
- Mistake 2: adding a few smart plugs and calling the result whole-home power
- Mistake 3: comparing sensors with inconsistent units
- Mistake 4: treating statistics as live telemetry
- Mistake 5: collecting data without a decision in mind
- Safety: measure loads with appropriate hardware
- The dashboard I would build first
- Conclusion
Key takeaways
- Use power sensors in W or kW for the live dashboard and energy sensors in Wh or kWh for accumulated consumption; they represent different physical quantities.
- A useful native layout combines one whole-home Sensor card, a Distribution card for current appliance or circuit loads, and a History Graph for recent spikes and duty cycles.
- If a device only exposes instantaneous watts, Home Assistant's Integral helper can derive an energy sensor that can then feed the Energy dashboard or period-based totals.
- Whole-home monitoring is not required to start, but plug-level data only represents the devices you actually meter and should not be presented as the home's complete load.
Editorial transparency
Who worked on this article and how it was handled.
- Written by
- Maya Chen
- Creation method
- Editorial research
AI assistance: AI assisted with research organization and drafting. Sources, factual claims, and the final article should be reviewed by a human editor before publication.
A household energy dashboard can look impressive and still answer the wrong question. The most common mistake is showing kilowatt-hours and calling the result “real-time power,” even though kWh tells you how much energy has accumulated rather than how hard the home is drawing electricity right now.
For live troubleshooting, the number you usually want is power in watts (W) or kilowatts (kW). That is what reveals the jump when a kettle starts, the cycling pattern of a refrigerator, or the combined load when an air conditioner and clothes dryer run at the same time. For bills and daily totals, you need energy in watt-hours or kilowatt-hours instead.
Home Assistant can handle both, but the cleanest setup treats them as two layers: a real-time dashboard for current power and a separate energy layer for accumulated consumption. This guide shows how to structure that dashboard, which native cards work best, and how to turn watt readings into useful kWh data without building a misleading energy display.
First: watts and kWh are not interchangeable
Home Assistant’s own energy documentation makes the distinction explicit: power is a rate, while energy is an amount accumulated over time.
Think of it like speed and distance:
| Measurement | What it tells you | Typical unit | Dashboard use |
|---|---|---|---|
| Power | How fast electricity is being used now | W or kW | Live household load, appliance spikes, automation thresholds |
| Energy | How much electricity was used over time | Wh or kWh | Daily totals, monthly consumption, cost analysis, Energy dashboard |
A 2,000 W electric heater is drawing power at a rate of 2 kW while it is on. If it stays at that level for 30 minutes, it consumes roughly 1 kWh of energy during that period.
That distinction should drive the dashboard design. If the question is “What is drawing power right now?”, build around power entities. If the question is “How much did we use today?”, use energy entities.
Decide what level of power data you actually have
Before editing a dashboard, inventory your sensors. Home Assistant can only visualize what your devices and integrations report.
There are three useful levels of household monitoring.
Whole-home power
A whole-home meter or compatible energy monitor can expose a sensor representing the home’s current electrical load. This is the best source for a large number at the top of a dashboard because it includes loads you may not monitor individually.
Your actual entity might look something like:
sensor.house_powerThe entity name is only an example. What matters is that its state represents current power and uses an appropriate power unit such as W or kW.
Circuit-level power
Circuit monitoring provides a middle layer between the whole home and individual plugs. It can be useful for fixed loads such as HVAC equipment, ovens, water heaters, or dedicated appliance circuits.
This is especially valuable when a load cannot appropriately be connected through a consumer smart plug.
Appliance-level power
Energy-monitoring smart plugs and appliance integrations can expose live power for specific devices, for example:
sensor.dishwasher_power
sensor.washing_machine_power
sensor.office_setup_power
sensor_tv_power
The important limitation is coverage. If you only meter six plugs, adding those six values together does not produce the complete household load. Lighting circuits, HVAC, hard-wired appliances, and unmonitored outlets are missing.
Label partial monitoring accurately. “Monitored appliances” is better than “whole-home power” unless the data really covers the whole home.
Check the power entities before designing the dashboard
A reliable dashboard starts with well-formed sensor entities.
Home Assistant recognizes power as a sensor device class and supports units including W and kW. For present-time measurements, power sensors normally behave as measurement entities rather than cumulative totals.
Before building cards, inspect the entity in Home Assistant and confirm:
- the value changes when the appliance load changes;
- the unit is W or kW;
- the entity is available consistently;
- the update frequency is useful for the behavior you want to observe;
- the number is physically plausible for the device being monitored.
A dashboard cannot make a sensor more real-time than the underlying integration. If a cloud integration only reports every few minutes, the card will reflect that cadence. Local meters may update much more frequently, depending on the device and integration.
The best native dashboard layout for live household wattage
You do not need a custom frontend to build a useful power dashboard. Home Assistant’s native cards are enough for a strong first version.
A practical layout has four layers:
- Current total load — one prominent power sensor.
- Current load distribution — the largest monitored appliances or circuits side by side.
- Recent power history — enough history to see spikes and cycling.
- Accumulated energy — daily or longer-term kWh, kept visually separate from the live power cards.
This hierarchy prevents a common dashboard failure: filling the screen with numbers without telling the reader which numbers describe “now” and which describe “over time.”
Card 1: use a Sensor card for the current household load
The native Sensor card shows the current state of one sensor and can optionally include a small history graph. That makes it a good top-level card for whole-home power.
Example:
type: sensor
entity: sensor.house_power
name: Home Power Now
graph: line
hours_to_show: 6
Replace sensor.house_power with your actual power entity.
The current value should be the most visually important number on the page. Six hours of history is often enough to reveal the shape of the day without turning the first card into a long-term analytics panel.
What you can learn from this card
Watch the live number while deliberately switching known loads on and off. That gives you an intuitive sense of the home’s baseline.
For example, if the house sits near 350 W and jumps to 2,000 W when a specific appliance starts, the change is more informative than the absolute number alone. Repeating that exercise with major devices builds a mental map of your home’s load profile.
Card 2: use the Distribution card for appliance and circuit loads
Home Assistant’s native Distribution card is particularly well matched to this use case. It displays current values from multiple related entities as segments, making it easy to compare power sensors from different loads.
Example:
type: distribution
title: Current Monitored Loads
entities:
  - entity: sensor.hvac_power
    name: HVAC
  - entity: sensor.washing_machine_power
    name: Washer
  - entity: sensor.dishwasher_power
    name: Dishwasher
  - entity: sensor.office_power
    name: Office
This view answers a different question from the whole-home total: which monitored load is responsible for the current draw?
The wording “monitored loads” is deliberate. Unless every relevant circuit is represented, the segments are not a complete breakdown of household power.
Keep the list short enough to read
A power dashboard becomes less useful when dozens of tiny loads compete for attention. Start with the devices or circuits most likely to matter:
- HVAC or portable heating/cooling;
- water heating where separately monitored;
- laundry;
- dishwasher;
- entertainment equipment;
- home office or server rack;
- EV charging;
- other large or frequently used loads.
Small standby devices can be grouped or moved to a secondary view.
Card 3: add a History Graph for recent spikes and cycles
The History Graph card can display multiple entities over a recent time window. This is where live wattage becomes diagnostic rather than decorative.
Example:
type: history-graph
title: Power — Last 6 Hours
hours_to_show: 6
entities:
  - entity: sensor.house_power
    name: Home
  - entity: sensor.hvac_power
    name: HVAC
  - entity: sensor.dishwasher_power
    name: Dishwasher
Keep entities on the same graph when they share compatible units. If one sensor reports kW and another W, normalize them or separate the cards so the graph remains easy to interpret.
Patterns worth looking for
A recent power graph can reveal:
- a refrigerator or air conditioner cycling on and off;
- a washer moving between wash, heat, and spin phases;
- a device that never returns to its expected standby level;
- overlapping high loads;
- a high overnight baseline;
- power that remains elevated after everyone leaves home.
The graph does not automatically tell you that a pattern is wasteful. It gives you evidence to investigate.
Card 4: use statistics for trends, not for second-by-second monitoring
Home Assistant’s Statistic and Statistics Graph cards are valuable, but they serve a different purpose. Home Assistant gathers supported short-term statistics at five-minute intervals and stores hourly aggregates for long-term statistics.
That makes statistics excellent for questions such as:
- What was the mean household load today?
- What was the maximum power during the evening peak?
- Is the overnight baseline rising over several weeks?
It makes them less appropriate as the headline “right now” view.
A useful dashboard can therefore have a live section at the top and a trend section lower down. Readers can see the current state immediately and then scroll for context.
Convert watts to kWh with the Integral helper
Some devices expose power but not accumulated energy. Home Assistant provides the Integral helper—historically documented as the Riemann sum integral integration—to derive energy from power readings over time.
Home Assistant’s documentation specifically describes this as useful for billing scenarios where a source sensor reports watts but energy needs to be tracked in kWh.
An illustrative configuration looks like this:
sensor:
  - platform: integration
    source: sensor.washing_machine_power
    name: Washing Machine Energy
    unit_prefix: k
    round: 2
    max_sub_interval:
      minutes: 5
The result is an energy entity rather than another live power entity.
Why this belongs outside the live-wattage section
Once power is integrated over time, the question changes from “How much is the washer drawing now?” to “How much energy has the washer consumed?”
Keep both sensors if they are useful:
sensor.washing_machine_power   -> current W
sensor.washing_machine_energy  -> accumulated kWh
That pair gives you the best of both views.
Add the derived energy sensor to the Energy dashboard
Home Assistant’s Energy dashboard is built for electricity, gas, water, generation, storage, and individual-device consumption. Current Home Assistant documentation also allows compatible power sensors alongside energy sensors, but accumulated kWh remains the core quantity for consumption over time.
For an appliance that starts with a W sensor, the typical path is:
Power sensor (W)
      ↓
Integral helper
      ↓
Energy sensor (kWh)
      ↓
Energy dashboard / daily totals
This architecture is cleaner than trying to make one entity serve two meanings.
Use Utility Meter when you want daily or monthly buckets
After you have a valid energy entity, the Utility Meter helper can create period-based consumption meters. That is useful when you want dedicated entities such as:
sensor_washer_energy_daily
sensor_washer_energy_monthly
Exact entity names depend on how you configure the helper.
This approach is useful for dashboard summaries because a daily total has a clear meaning. It can also support tariff-aware setups when your energy plan differentiates usage periods, although utility billing structures vary widely by region.
Do not attempt to create a daily “watt” total. Totals over time should be energy quantities such as Wh or kWh.
A complete dashboard structure that stays understandable
For most homes, a useful power dashboard can fit into one view without becoming an engineering console.
Section 1: right now
Show:
- whole-home power in W or kW;
- largest monitored loads;
- optional grid import/export power if relevant.
The user should be able to answer “What is happening now?” in a few seconds.
Section 2: last few hours
Show:
- whole-home history graph;
- two to four major loads;
- enough history to catch cycling and evening peaks.
This section answers “What caused the current pattern?”
Section 3: today
Show:
- accumulated household kWh;
- energy for selected appliances;
- optional daily Utility Meter entities.
This answers “How much have we used?”
Section 4: longer-term trend
Use statistics or the Energy dashboard for:
- daily or weekly comparison;
- baseload trends;
- major appliance energy contribution;
- solar, battery, and grid flows if installed.
This answers “Is our behavior changing?”
Example dashboard YAML using only native cards
The following is an illustrative starting point. The entity IDs are examples and must be replaced with sensors from your own Home Assistant instance.
type: sections
max_columns: 2
sections:
  - type: grid
    cards:
      - type: heading
        heading: Power right now
      - type: sensor
        entity: sensor.house_power
        name: Home Power Now
        graph: line
        hours_to_show: 6
      - type: distribution
        title: Current Monitored Loads
        entities:
          - entity: sensor.hvac_power
            name: HVAC
          - entity: sensor.washing_machine_power
            name: Washer
          - entity: sensor.dishwasher_power
            name: Dishwasher
          - entity: sensor.office_power
            name: Office

  - type: grid
    cards:
      - type: heading
        heading: Recent load history
      - type: history-graph
        title: Last 6 Hours
        hours_to_show: 6
        entities:
          - entity: sensor.house_power
            name: Home
          - entity: sensor.hvac_power
            name: HVAC
          - entity: sensor.washing_machine_power
            name: Washer
Home Assistant dashboards can also be configured visually, so YAML is not mandatory. The important part is the information hierarchy, not the configuration method.
How to find phantom loads without fooling yourself
One of the most useful reasons to build a live power view is investigating baseload—the power your home keeps drawing when very little is intentionally running.
A practical process is:
- Note the whole-home wattage during a quiet period.
- Turn off or unplug a suspected discretionary load.
- Wait for the sensor to update.
- Record the change.
- Repeat with one load at a time.
Do not assume every unexplained watt is waste. Refrigerators, network equipment, ventilation, security systems, sump pumps, heating controls, and other legitimate loads may operate continuously or intermittently.
The dashboard’s job is to reveal the pattern so you can decide whether the load is necessary.
Power thresholds can turn the dashboard into automation
Home Assistant’s Power integration supports triggers and conditions for entities with the power device class. That means the same data used for visualization can also support automations based on live load changes.
Potential uses include:
- detecting that a washing machine has finished after power drops below a threshold;
- warning when total household load exceeds a chosen level;
- identifying an appliance that remains above its normal standby draw;
- delaying discretionary loads when another high-power device is already running.
Thresholds must be tuned to the actual device. A washer, heat pump, and induction cooktop have very different power profiles, so avoid copying arbitrary watt values from another household.
Common mistakes that make power dashboards misleading
Mistake 1: labeling kWh as “current power”
kWh is accumulated energy, not instantaneous wattage. Fix the label or use the correct entity.
Mistake 2: adding a few smart plugs and calling the result whole-home power
That only measures monitored appliances. Use a whole-home source if you want a true total.
Mistake 3: comparing sensors with inconsistent units
Keep W with W or normalize values before visually comparing them. Mixing W and kW without clear formatting makes a dashboard easy to misread.
Mistake 4: treating statistics as live telemetry
Five-minute statistics and hourly long-term aggregates are useful for trends, but they are not substitutes for the current state of a power sensor.
Mistake 5: collecting data without a decision in mind
A dashboard should help you answer a question: which load is on, what caused a spike, how high is the baseline, or how much energy was used today. More cards are not automatically more insight.
Safety: measure loads with appropriate hardware
Energy monitoring involves electricity, so the measurement method matters as much as the dashboard.
For plug-in monitors and energy-monitoring smart plugs:
- stay within the manufacturer’s current, power, and appliance ratings;
- do not assume a smart plug is appropriate for heaters, air conditioners, refrigerators, or other high-inrush loads merely because the plug physically fits;
- do not defeat grounding or modify plugs and cords;
- use hardware certified for your region where applicable.
Whole-home and circuit-level monitoring can involve an electrical panel, mains conductors, or current transformers around service wiring. If installation requires opening energized equipment or working inside the electrical panel, use a qualified electrician and follow local electrical requirements and the monitor manufacturer’s instructions.
The Home Assistant configuration is the easy part. Electrical safety is not the place to improvise.
The dashboard I would build first
If you are starting from scratch, resist the urge to monitor every outlet.
A high-value first version needs only:
- one trustworthy whole-home power sensor, if available;
- three to six major appliance or circuit power sensors;
- one live Sensor card for the home total;
- one Distribution card for monitored loads;
- one six-hour History Graph;
- derived kWh entities for the loads where accumulated energy matters.
Use it for a week before adding more. You will quickly learn which devices deserve permanent visibility and which numbers are just dashboard clutter.
Conclusion
A good Home Assistant household power dashboard should make one distinction obvious: watts tell you what the home is drawing now; kWh tells you how much energy it has used over time.
Build the live view around power sensors, use the native Distribution and History Graph cards to expose the loads behind the total, and convert watt data to kWh with the Integral helper when you need accumulated consumption. Start with a small number of trustworthy sensors, label partial monitoring honestly, and only expand the dashboard when the additional data helps you make a real energy decision.
Common questions
Questions this guide answers
Can Home Assistant show household power use in real time?
Yes. Home Assistant can display power entities that report watts or kilowatts and update as the underlying integration provides new readings. A normal dashboard is usually the clearest place for a live wattage view, while the Energy dashboard is better for accumulated consumption and longer-term energy flows.
What is the difference between watts and kWh in Home Assistant?
Watts measure power, which is the rate of energy use at a particular moment. Kilowatt-hours measure energy accumulated over time. A 1,000 W load running for one hour uses approximately 1 kWh, so live wattage and billed energy should be represented by different sensor entities.
How do I convert a Home Assistant power sensor from W to kWh?
Use Home Assistant's Integral helper, also documented as the Riemann sum integral integration. It numerically integrates a power sensor over time and can produce an energy entity in kWh that is suitable for energy tracking when the source sensor is configured correctly.
Which Home Assistant card is best for comparing appliance wattage right now?
The native Distribution card is designed to compare current values from related entities and is a strong fit for power sensors from multiple appliances or circuits. A Sensor card works well for the whole-home total, while a History Graph card is better for seeing recent spikes and cycles.
Do I need a whole-home energy monitor to build a power dashboard?
No. You can begin with energy-monitoring smart plugs or appliance integrations that expose power sensors. A whole-home or circuit-level monitor becomes useful when you want a complete household total or coverage for fixed loads that cannot safely be measured through a plug-in device.
Evidence & further reading
Sources & references
Primary and authoritative references used to support or contextualize this article. Links open the original source.
- 1Home energy management
Home Assistant · Accessed Aug 24, 2026
Supports Energy dashboard setup, individual-device tracking, use of power sensors, and conversion of instantaneous power into accumulated energy.
- 2Frequently Asked Questions about home energy management
Home Assistant · Accessed Aug 24, 2026
Supports the distinction between power in W or kW and accumulated energy in Wh or kWh.
- 3Power
Home Assistant · Accessed Aug 24, 2026
Supports using power entities for present-time load conditions and distinguishing live power from accumulated energy.
- 4Integral
Home Assistant · Accessed Aug 24, 2026
Supports converting a power sensor in watts into an energy sensor such as kWh using numerical integration.
- 5Integrating individual device energy usage
Home Assistant · Accessed Aug 24, 2026
Supports individual-device energy tracking and using power sensors as sources for derived energy entities.
- 6Distribution card
Home Assistant · Accessed Aug 24, 2026
Supports comparing current values from multiple related entities such as power sensors from different loads.
- 7Sensor card
Home Assistant · Accessed Aug 24, 2026
Supports displaying a sensor's current state with an optional graph for recent changes.
- 8History graph card
Home Assistant · Accessed Aug 24, 2026
Supports plotting recent history for multiple entities and using long-term statistics where available.

About the author
Maya Chen
Maya covers residential energy, HVAC controls, and practical home automation, translating technical systems into useful decisions for homeowners and renters.
More from Maya →Make your home smarter without buying every gadget.
One useful idea, one product worth knowing, and one energy-saving action—delivered weekly.
No spam. Unsubscribe anytime.
Semantic recommendations
Related reading
Selected from topic cluster, entities, tags, search intent, and editorial relationships.
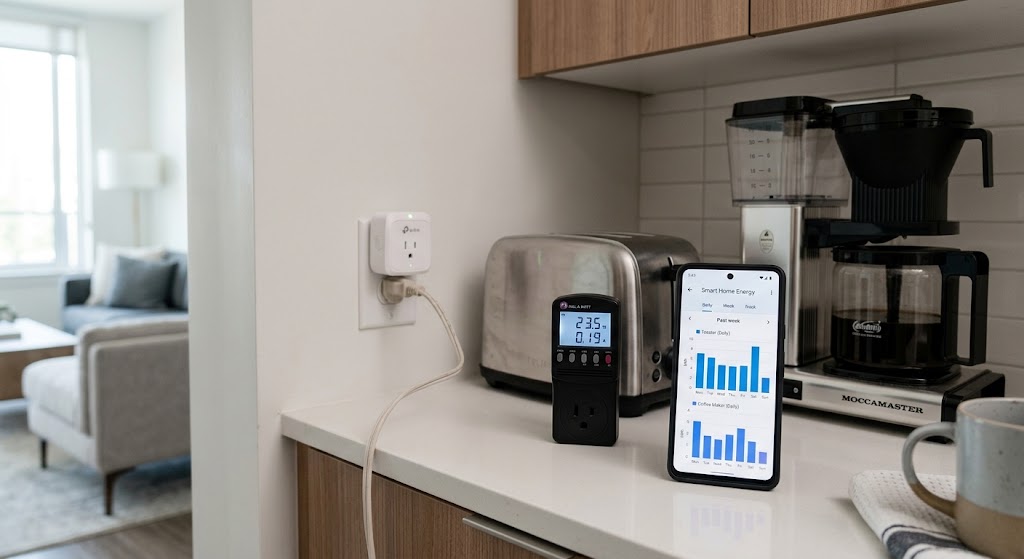
How to Track Appliance Energy Draw Before Fall Electricity Rate Hikes
Measure appliance electricity use before a tariff change so you can identify costly loads, estimate their real monthly cost, and cut waste with better data.
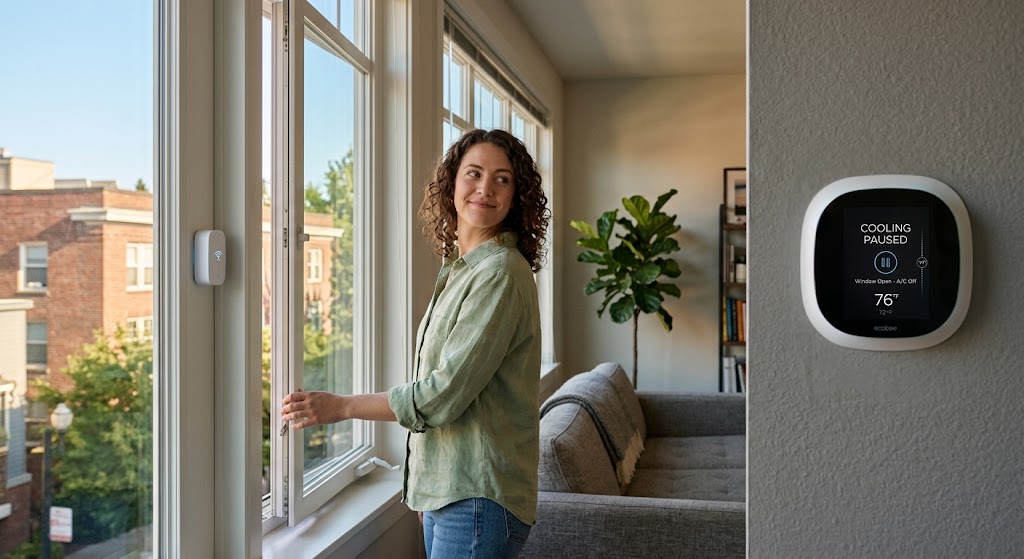
Smart Window Contact Sensors: Preventing Open Window AC Energy Waste
Use window contact sensors to pause cooling only after a window stays open, then restore the previous HVAC state safely after every monitored window is closed.
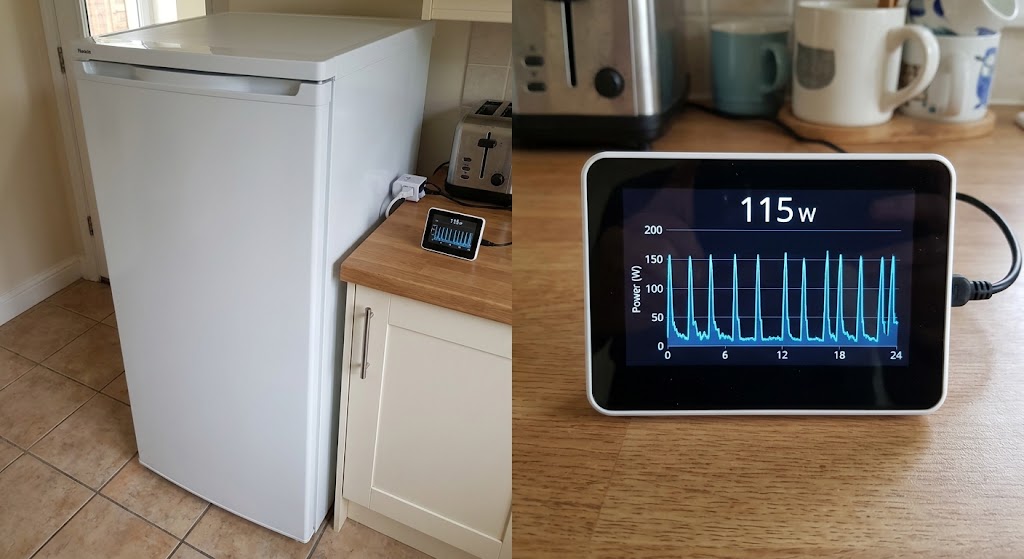
How Energy Monitoring Smart Switches Detect Failing Refrigerator Motors
Energy monitoring can reveal abnormal refrigerator power patterns before a breakdown, but it works best as an early-warning tool rather than a motor-failure diagnosis.
Portable Power Stations for Late-Summer Outdoor Patio Movie Nights
Plan a reliable patio movie night by sizing a portable power station for your projector, speakers, streaming gear, and late-summer heat.